
Weekly Chart
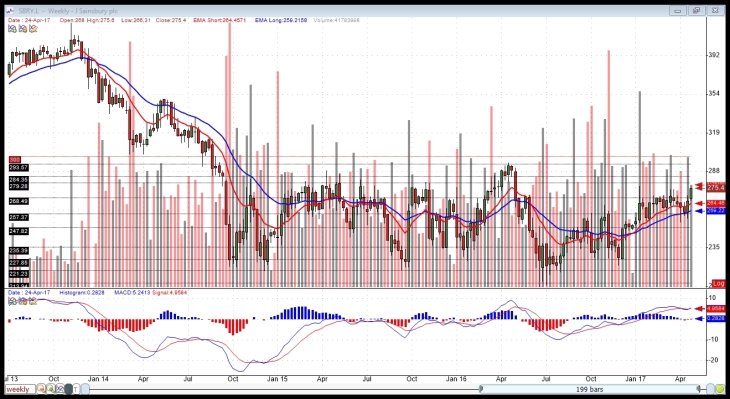
SBRY continues trading within the range it has been in since Oct. 2014. MACD histogram has been trending bearishly since January, reflecting gradually declining upward momentum.
Long Daily Chart

The long daily chart shows a recent uptick in volume, suggesting more volatile times for this stock may lie ahead. I note that the most recent candle overshot a line of resistance I identified at 279.29p.
Short Daily Chart

The most recent candlestick suggests an exhaustion move has been made an a reversal is imminent. Price has also reached the upper price channel. MACD histogram is nearly as high as its highest value in 200 trading days. There is something of a bullish divergence evident in Force Index.
I will short this stock tomorrow morning. I will place my initial stop at 293.5p, per my stop loss formula. I will place a limit order to cover my position at 268p.
Entry: My order to open was filled on 03 May.17 at 273.4p.

Exit: My limit order was filled on 03.May.17 at 267.5p for a gross return of +2.16%.
