
Weekly Chart
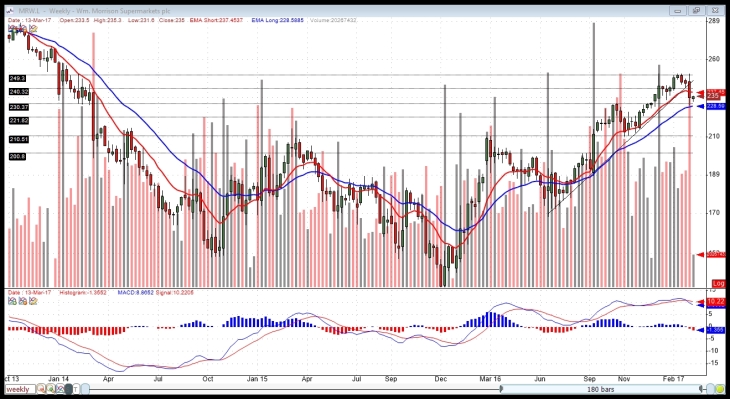
MRW has been in an uptrend for over a year. There is a bearish divergence between price and MACD histogram evident in this chart which raises the possibility of a correction or trend reversal may develop in the coming weeks.
Long Daily Chart
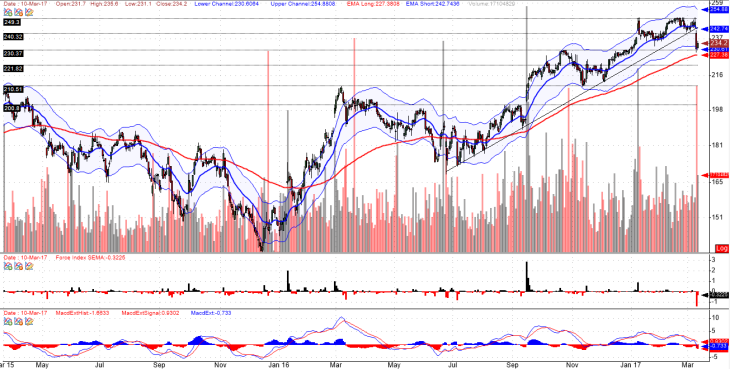
MRW’s price fell on 09.Mar.17 to 230.8p, around .5p below its lower price channel. This stock has demonstrated a fairly reliable tendency to reverse course after breaching its price channels.
Short Daily Chart
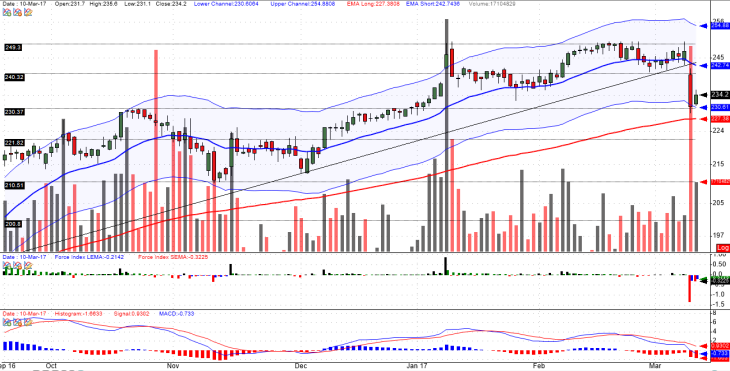
MACD histogram is nearly as low as it has ever gotten over the past 120 and 500 trading sessions. Force index over the past two trading days suggests the selloff on 09.Mar.17 may be over, at least temporarily, and that a price rebound is imminent.
I continue to believe that the longer term charts are bearish, but in the short term I think it is likely that this stock’s price will rebound to somewhere within the 237-240p range. I am therefore going to take open a long position tomorrow morning. Because I am less confident about this call than I would ideally like to be, I will be using a wider stop where x = 15 (see here for details). The size of my position will therefore be smaller than it would be if I used my usual tighter stop loss. I will place a limit order to sell at 240p and monitor closely to sell at a lower price if it looks to me as though price will not climb to that level.
Entry: I entered a long position on 13.Mar.17 at 234.2p.
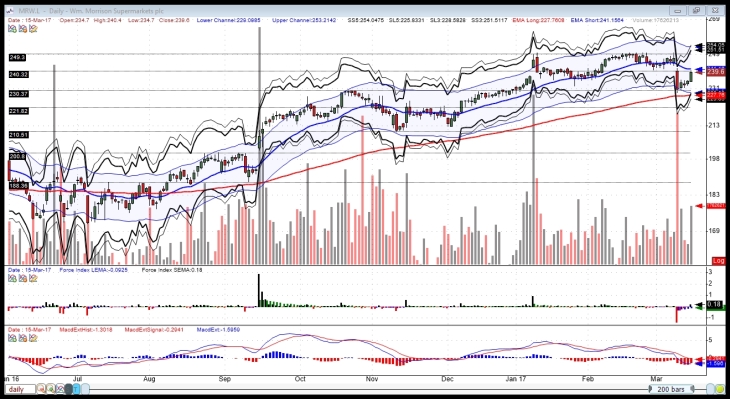
Exit: I closed my position on 15.Mar.17 at 240.0p for a gross return of +2.48%
